|
| |
Simulation of Materials Handling Systems
in the Mines: Two Case Studies
Dr. Alexander A. Lebedev, P.E.
P. 0. Box 73621
Lynnwood Ridge 0040
South Africa
E-mail: swans@intekom.co.za |
Phillip Staples, P.E.
P. 0. Box 1677
Bedfordview, Johannesburg 2008
South Africa
E-mail: cdisa@icon.co.za |
In the February 1998 issue of SIMULATION, Alexander Lebedev discussed the applicability of
continuous and discrete simulation modelling techniques on bulk conveying systems. In this article,
he and Phillip Staples continue on the subject by presenting two case studies simulating real
mining operations. The first deals with development and verification of a process control algorithm
for underground bunkers on a simulation model. The objective of the other is sizing of surge and
storage facilities.
Keywords: Mining, conveyor, bunker, stockyard, capacity.
1. Introduction
In referenced papers that describe case studies of application of simulation to modelling bulk
conveying systems - primarily in the mining industry - the authors used discrete simulation software
tools to quantify the performance of a mining operation at a given set of resources [1, 2]. Nowhere
in the published literature [3,4,5] were examples found of the use of continuous simulation
modelling approaches for the purpose of control as well as for sizing of materials handling
equipment.
2. Case Study: Controlling Underground Bunkers
2. I. Introduction to and Objective of the Simulation Study
In this study, an underground mine produces material from a number of mining sections, each provided
with a feeder-breaker. In these mining sections, the material is loaded onto shuttle cars that
transport and tip the material into feeder-breakers. From the feeder breakers, the material is sent
to the conveyors that feed the bunkers. There are 12 feeding conveyors in total; ten feed the bunkers
and the other two feed the trunk conveyors directly (A14, A18).
The capacity of feeder-breakers is 600 tons per hour (t/h). The capacity of the shuttle cars varies,
and it can be either 14.5 or 9.0 tons. The smaller shuttle cars operate in mining sections that feed
conveyor A18 only. All the rest of the mining sections make use of 14.5-ton cars. The mine logged the
number of tips into each feeder-breaker, and the numbers were then converted into average feed rates
of the relevant feeding conveyors. However, for conveyors A14 and A18, instead of flow rates, discrete
feed of parcels equivalent to the load of the shuttle cars was applied with the actual inter-arrival
time.
There are in total seven bunkers in the system, each with a 1,000-ton capacity. Five of them - numbered
3 to 7 and later referred to as "surge bunkers" - receive the material from the feeding conveyors. The
other two bunkers - numbers 1 and 2, which will be called "main bunkers" - are fed by the trunk
conveyors (see Figure 1).
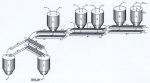
Figure 1. Schematic flowchart of the conveyor system
Each of the bunkers is provided with four vibrating feeders, two for each trunk conveyor. The
vibrating feeders each have a 600 t/h capacity. The rate of discharge can be controlled in steps of
200 t/h; i.e., the discharge rate from a vibrating feeder onto a trunk conveyor belt can be 0, 200,
400 or 600 t/h. Each of the four vibrating feeders can be controlled individually.
The level of material in the bunkers is monitored. There are two identical trunk conveyor lines
in use, each consisting of four conveyors rated at 2,500 t/h. Material is transferred from one
conveyor belt to the other to make up a continuous line, as shown in Figure 1. Conveyors C13 and C14
can feed main bunkers on an alternative basis; however, conveyor C13 feeds primarily bunker 1, and
conveyor C14 feeds bunker 2.
The current flow rate of conveyor belts CO8/07, C06/05 and D02/01 is monitored by belt weighers.
The problems at this mine were caused by a lack of control over mining sections operation and
over discharge rates from the surge bunkers on the trunk belts. This resulted in overflow of the
bunkers and the trunk belts. Every time a trunk belt was overloaded, a stoppage of about six hours was
required for cleaning. If a surge bunker overflowed, the corresponding mining sections had to be shut
down. The loss of production due to breakdowns of the equipment and overflow of conveyor belts was
40%.
The objective of the simulation project was to develop and verify a process control algorithm
with a simulation model to:
- Avoid overflow of the surge bunkers, and
- Eliminate excessive feed of the trunk conveyor belts to minimise the probability of blockages.
2.2. Simulation Approach and Assumptions
In a discussion with the mine, it was decided that in view of the inertia of the vibrating
feeders, control actions to reduce or increase the discharge rate would begin within a period of
10 minutes. The current discharge rate of a vibrating feeder was sampled from a random distribution,
and no harmonic profile could be assigned to it, However, the control step excitation had a longer
period than the transport delay of a trunk belt; therefore, a continuous simulation approach was
applied in accordance with the conclusion of the paper, "Simulation Modelling of Bulk Conveying
Systems" [6].
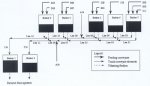
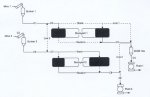
Due to the fact that in a simulation model a conveyor may only be loaded at the rear, the actual
conveyor belts had to be divided into segments between the feed points, consecutively linked
together (see Figure 2).
Figure 2. Block diagram of the simulation model
The actual discharge rate from a vibrating feeder was simulated as a distribution to take into account
the effect of dispersion of the parficle size. The profile of the distribution, which is shown in
Figure 3, was based primarily on the operation experience of the mine personnel.
Figure 3. Discharge rate distribution
Four vibrating feeders physically installed beneath each bunker were simulated as two outputs,
each responsible for equivalent discharge of material from the bunker onto one of the two trunk
conveyor belts.
The maximum theoretical feed rate of a trunk conveyor line was assumed to be 50 tons per minute (t/m),
or 3,000 t/h, to allow for detection of the overload of a conveyor belt. It was assumed that a conveyor
would be blocked any time the current flow rate exceeded some pre-set value defined by the user. The
average downtime period to clean the belt and remove spillage was set at six hours.
In addition to overloads of the conveyor trunk belts, mechanical breakdowns were also introduced into
the model. The mean time between failures (MTBF) of every individual trunk conveyor was sampled from
a negative exponential distribution with a mean of 6,220 minutes. The mean time to repair (MTTR) was
sampled from a Gamma distribution with a mean of 260 and a variation of 130 minutes.
It was assumed that the feeder-breakers could be controlled by means of red and green "tipping
lights." A shuttle car was allowed to tip material into the feeder-breaker only if the green light
was on. If the red light was lit, no material could be discharged into the feeder-breaker.
A simple yet robust algorithm was developed to control the discharge of material from the
surge bunkers onto the trunk conveyor belts to avoid overload, as well as to control the tipping
process of the shuttle cars into the feeder-breakers to prevent the bunkers from overflowing. The
objective of the algorithm was to maintain the total discharge rate of the material from the surge
bunkers on each of the two trunk belts (not exceeding 1,900 t/h) to accommodate the parcels arriving
from conveyors A14 and A18 at a 600-t/h rate (those two conveyors were not managed) and to delay the
tipping of shuttle cars in the mining sections if there was a risk of the surge bunkers overflowing.
Some minimum residual volume of material in the surge bunkers was also set in the algorithm.
This algorithm was also designed to account for any types of breakdowns of the trunk conveyors;
however, it cannot be described here due to an agreement with the user.
2.3. Discussion of Simulation Results
The model was run for a period of a full calendar year in accordance with the actual mine's work
schedule (4,968 working hours).
A total of 11.3 million tons (Mt) of material was produced by the mine, which made up ±60%
of the theoretical capacity. The effect of the interruption in the shuttle-car tipping by the
control algorithm was negligible, however: only ±0.5 Mt of material was rejected by the system
in the peak periods. That meant, first of all, insufficient productivity of the mining sections
as well as irregular profiles of the shuttle car arrivals.
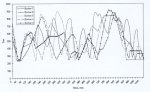
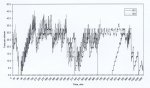
The example of the feed into bunker 7 is presented in Figure 4.
Figure 4. Feed to bunker 7
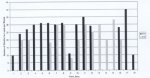
Direct feed in batches from conveyors A14 and A18 to the trunk belts during the first two
shifts is shown in Figure 5. It can easily be seen that all the feed conveyors deliver maximum tonnage
in the middle of a shift, starting with and dropping to zero at the beginning and at the end of the
day. In Figure 4 an effect of the control algorithm can be noted with sharp reduction of the feed rates
of all the conveyors at approximately the middle of the second shift.
Figure 5. Direct feed to the trunk conveyors
High utilisation of all the conveyors feeding the bunkers was recorded, ranging from 77%
to 900%, though still at lower-than-designed flow rates. Directly feeding conveyors due to the limited
input from the mining sections and short transport delay caused idling for 74% to 79% of active
time.
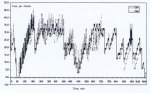
An example of the plots of the current level of material in the surge bunkers is given in
Figure 6.
Figure 6. Current level of coal in bunkers
The most important observation from the plots is that the level of material in all the surge bunkers
was below 900 tons (t). Full capacity is 1,000 t. This was confirmed by the simulation statistics
gathered during the whole simulated period, shown in Table 1.
| |
Volume, tons |
|
Time, % |
Name |
In |
Out |
Currently
In |
Avg In |
Avg Time
In, Min |
Flowing |
Empty |
Full |
Partly
Full |
Off-Shift |
Bunker 1 |
5,455,890 |
4,455,680 |
200 |
194.4 |
10.6 |
100 |
20.8 |
0.0 |
79.2 |
43.3 |
Bunker 2 |
5,501,750 |
5,501,550 |
192 |
197.4 |
10.7 |
100 |
20.0 |
0.0 |
79.2 |
43.3 |
Bunker 3 |
1,723,940 |
1,723,650 |
292 |
515.4 |
89.1 |
100 |
0.0 |
0.0 |
80.1 |
43.3 |
Bunker 4 |
1,189,370 |
1,189,050 |
315 |
499.7 |
125.2 |
100 |
0.0 |
0.0 |
100.0 |
43.3 |
Bunker 5 |
2,965,820 |
2,965,570 |
246 |
551.3 |
55.4 |
100 |
0.0 |
0.0 |
100.0 |
43.3 |
Bunker 6 |
969,778 |
969,546 |
233 |
518.1 |
159.3 |
100 |
0.0 |
0.0 |
100.0 |
43.3 |
Bunker 7 |
3,580,690 |
3,580,440 |
245 |
584.5 |
48.7 |
100 |
0.0 |
0.0 |
100.0 |
43.3 |
The average amount of material in surge bunkers 3 through 7 ranged from 500 to 585 tons. What
is even more important is that these bunkers were never empty or full.
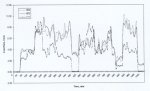
Current readings of the belt weighers installed in the head of conveyors D01 and D02 for one
working day are plotted in Figure 7.
Figure 7. Readings of belt weighers
Virtually no peaks exceeding 42 t/m (2,500 t/h) have been noted during the whole
simulation run, thus ensuring smooth operation of the trunk belts.
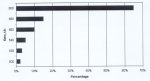
The utilisation of the trunk conveyors is presented in Figure 8. Bearing in mind that real trunk
conveyor belts were divided into segments between the feed points, the codes on the bar chart
correspond to the last segments of the relevant trunk belts (refer to Figures 1 and 2).
Figure 8. Utilisation of trunk conveyors
Plots in Figure 7 represent the behaviour of the trunk conveyors with no breakdown within a
two-shift-per-day operation. The effect of breakdowns of conveyor C08 with a three-hour duration
starting at 400 minutes from the very beginning, and of conveyor D01 with a two-hour duration
starting at 700 minutes, is shown in Figure 9.
Figure 9. Effect of breakdowns on trunk conveyor delivery
It is important to note that in the event of breakdown of the first conveyor in line (C08),
the effect on the delivery rate of the whole line was negligible, specifically taking into account
the natural decline in production at the end of the day shift when all the bunkers were being
emptied to the lowest permissible level. Then the control algorithm maintained the delivery of the
trunk conveyor line at a rate very close to the target of ±31 t/m.
The effect of the breakdown of conveyor D01, the last one in the line, on delivery performance
was much heavier as the entire line became blocked. However, once the healthy status of the conveyor
was restored, the delivery was step-by-step brought to the target level.
The comparative statistics on the performance of the system in two scenarios is summarised in
Table 2.
Table 2. Effects of breakdowns
Description |
Unit |
No
Breakdown |
Breakdown
Induced |
Total average
delivery rate |
t/h |
2,660 |
2,555 |
| Utilisation C07 |
% |
92 |
81 |
| Utilisation C08 |
% |
91 |
76 |
| Utilisation C05 |
% |
94 |
85 |
| Utilisation C06 |
% |
95 |
95 |
| Utilisation D01 |
% |
96 |
86 |
| Utilisation D02 |
% |
96 |
98 |
| Utilisation C13 |
% |
96 |
86 |
| Utilisation C14 |
% |
96 |
98 |
| Note: Broken-down conveyors are shaded |
Insignificant reduction in the throughput of the system of some ±4% was due to inadequate
performance of the mining sections delivering some ±40% less than the design capacity of system. In
other words, while a conveyor was broken down, the mining sections still carried out production of
material that was accommodated in the surge bunkers, which were always running with some available
space inside. Once the conveyor's operational status was recovered, the trunk belts had enough spare
capacity to remove the excessive y accumulated material from the system. In the event of the
utilisation of all the equipment at the maximum design capacity, that result would have been much
more difficult to achieve.
2.4. Results of the Case Study
- An algorithm was developed to control the feed of the mining sections into the surge bunkers and
the discharge rate onto the trunk conveyor belts for an underground mine. The control objectives were
to prevent the overflow of the bunkers, eliminate blockages of the trunk belts due to overload and
maintain smooth, uninterrupted operation.
- The efficiency of the control algorithm was verified with the simulation model, and the results
of experimentation with the model proved that the objectives of the control algorithm were
achieved.
- The algorithm was then implemented in a new PLC-based process control system installed on the
mine after completion of this study. According to feedback from the operators, the surge bunkers
have been running at ±60-70% average level and no overloads of the trunk belts have occurred.
- The problem identified at that stage was insufficient throughput of the mining sections
resulting in the average delivery rate of the system at ±60% of its design capacity.
3. Case Study: Sizing Bulk Handling Equipment
3.3. Introduction to and objective of the Simulation Study
An existing Mine 1 mines material, which is conveyed into bunker 1, then via conveyors Cl and C2 into
an existing stockyard 1, comprising 2 x 70,000 t stockpiles (see Figure 10). From the stockyard,
material is reclaimed and conveyed via conveyor C3 into an 8,000-ton silo, feeding material to
processing plants 1 and 2 via conveyor C4, link 2.
Figure 10. Material Flowchart
The expansion plans of the mine involve establishment of a new underground operation (Mine 2),
deploying six to 16 mining sections that will feed the new incline conveyor C5. In each section, a
feeder-breaker will be installed to allow for tipping of material from the shuttle cars onto a
conveyor belt, C5 will feed a new bunker 2, which will feed material to a new overland conveyor C6.
A new stockyard may be required to accommodate the feed from the new mine or, alternatively, the
capacity of the existing stockyard may be adjusted accordingly.
It is supposed that material from the new mine will be predominantly supplied to plant 2, while
plant 1 will consume material mainly from the existing mine. However, the old mine must be able to feed
material to plant 2 if required; it is considered higher priority due to the absence of any entry
buffer, and once a stockpile is exhausted, the plant will be idling.
The objectives of the simulation study were therefore as follows:
- Size the new surge bunker 2, taking into account the feed of the new incline conveyor C5
delivering material from six to 16 underground mining sections to be quantified;
- Configure and size the stockyard to accommodate material coming from the existing Cl and the new
overland conveyors, and to provide feed into material processing plants 1 and 2 as uninterruptible as
possible at required rates of 1,200 and 2,000 t/h, respectively. Configuration of the stockyard
entails investigation of the sufficiency of the existing capacity and a definition of the new required
capacity if that becomes necessary.
3.2. Simulation Approach and Assumptions
Due to the integral nature of the task, the following continuous modelling approach was used to
simulate the operation of the new overland conveyor system and the existing facilities.
The mining operation was simulated as some virtual source of material providing inputs of the material
into the system with specified rates. Two inputs were modelled, feeding the existing conveyor Cl and
the new incline conveyor C5.
To define the size of the new surge bunker 2, a level monitor was modelled. The reading of the monitor
was updated every time it registered a higher level of material in the bunker. The following
considerations were taken into account to size the new surge bunker:
- The size of the bunker should prevent blockages of the feeding conveyor C5; i.e., it must
preferably never overflow;
- It is also important that the bunker never remain empty continuously, maintaining the required
feed into the stockyard.
The capacity of the existing stockyard should maintain the maximum utilisation of the reclaimer and
the reclaim conveyor; i.e., the reclaimer must always have some material in one of the two stockpiles
to reclaim. Therefore, the definition of the required size of the stockyard was based on the
minimisation of the idling time of the reclaimer-conveyor combination.
Three scenarios were simulated after discussions of the model with the mine and are shown in Table 3.
Table 3. Parameters of simulation scenarios
Description |
Scenario 1 |
Scenario 2 |
Scenario 3 |
| Stockyards |
Existing Only |
Existing and New |
Existing and New |
| Capacity of stockpiles (t) |
2 x 20,000 and
2 x 40,000 |
Old: 2 x 20,000
New: 2 x 25,000 |
Old: 2 x 20,000
New: 2 x 25,000 |
| Capacity of stacker (t/h) |
4,500 |
Old: 1,500
New: 3,000 |
Old: 1,500
New: 3,000 |
| Capacity of reclaimer (t/h) |
3,200 |
Old: 1,200
New: 2,000 |
Old: 1,200
New: 2,000 |
Capacity of new overland
conveyor (t/h) |
3,000 |
3,000 |
3,000 |
Capacity of new surge
bunker (t) |
5,000 |
5,000 |
5,000 |
Max capacity of new incline
conveyor (t/h) |
3,600 |
3,600 |
3,600 |
Scenario 3 was considered specifically to deal with interruptions of the feed into plant 1. In that
event, it was suggested to shut down Cl and route to Plant 1 material coming from C6 via link 3, C2 and
link 1, because Plant 1 was highly prioritised.
The existing mining operation delivers material to the Cl conveyor at a rather stable rate provided by
the belt weigher and surge bunker 1 feeding up the conveyor to maintain a 1,400- to 1,500-t/h feed. The
feed rate of conveyor Cl was therefore assumed to be a uniform distribution with a minimum of 23.5 and
maximum 25.0 t/m (average 1,455 t/h).
The feed of a new mining section was described as a square negative parabola with a maximum in the
middle of a shift and zero production at the beginning and at the end of the shift. The average feed
of a section over a one-shift period was assumed at ±220 t/h, as per a similar operation in one
of the operating underground mines.
Conveyor C5 conveys material into the new surge bunker 2, feeding the new overland conveyor at the
controlled average rate of 3,000 t/h.
Reclaim rates from the stockpiles and discharge rates from the surge bunkers were sampled from a
normal distribution with mean values as per the relevant parameters of Table 3.
Stacking and reclaiming took place on the alternative basis with reclaiming as first priority (a
stacker could not interrupt a reclaimer; however, once reclaiming was finished, the stacking had to
be stopped and the reclaimer moved to the other stockpile). A change-over time of 45 minutes was
allowed for stacker and reclairner motion and setup.
No simulation of plants 1 and 2 was required; however, defining the effects of the breakdowns and
maintenance stoppages on the throughput of the plants was delegated to conveyors C4 and C9 feeding
the plants.
Failures of both the mine and the plant were assumed to occur on a weekly basis. The MTBF was simulated
by the negative exponential distribution, and the MTTR by the Gamma distribution to obtain the above
availability as per standard statistical methods (see Table 4).
Table 4. Table of availability
Description |
Schedule 1 (Mine) |
Schedule 2 (Plant) |
| Applicable to equipment |
C5 |
C1, C4, C9 |
| Basis of stoppages |
Weekly |
Weekly |
| Working time per week (min) |
4,800 |
8,640 |
| Availability 85% |
MTBF (min) |
EXP (4,080) |
EXP (7,344) |
| MTTR (min) |
GAMMA (0.5, 1,440) |
GAMMA (0.5, 2,592) |
| Availability 87% |
MTBF (min) |
EXP (4,176) |
EXP (7,512) |
| MTTR (min) |
GAMMA (0.5, 1,248) |
GAMMA (0.5, 2,256) |
| Availability 90% |
MTBF (min) |
EXP (4,320) |
EXP (7,776) |
| MTTR (min) |
GAMMA (0.5, 960) |
GAMMA (0.5, 1,728) |
| Availability 93% |
MTBF (min) |
EXP (4,464) |
EXP (8,035) |
| MTTR (min) |
GAMMA (0.5, 672) |
GAMMA (0.5, 1,210) |
Further research on the availability effect was undertaken with respect to the key equipment in the
stock yard - namely, stackers, reclaimers with associated conveyors, and the new overland conveyor.
The 98% availability of that equipment was assumed and calculated exactly in the same way as for the
above equipment.
As in the previous case study, a full calendar year operation according to the actual mine work
schedule was simulated.
3.3. Discussion of Simulation Results
The level monitor in bunker 2 registered ±4,900 t maximum volume of material; therefore,
it was decided to retain the size of the bunker at 5,000 tons with a maximum of 11 underground
sections concurrently mining material.
The simulation report on production of material is presented in Table 5.
Table 5. Comparison of material production
Description |
Scenario 1 |
Scenario 2 |
Scenario 3 |
Stockpiles |
2 x 20,000 t |
2 x 40,000 t |
2 x 20,000 t
+ 2 x 25,000 t |
2 x 20,000 t
+ 2 x 25,000 t |
| Volume entered (tpa) |
18,862,300 |
20,239,500 |
18,184,000 |
15,533,701 |
| Volume shipped (tpa) |
18,846,800 |
20,216,400 |
18,148,400 |
15,515,378 |
| Current volume in system (t) |
15,526 |
23,096 |
35,606 |
35,352 |
| Average volume in system (t) |
16,249 |
23,808 |
39,978 |
32,536 |
| Average time in system (rein) |
453 |
618 |
1,156 |
1,066 |
The best production figure is obtained for the existing stockyard with 2 x 40,000-ton stockpiles (see
scenario 1 in Table 3).
Performance of the system in scenario 1 (with 2 x 20,000 t stockpiles) and in scenario 2 is similar.
Although intuitively one would think that the throughput capacity of a stockyard with 2 x 20,000 t and
2 x 25,000 t stockpiles would be better than for the 2 x 20,000 t stockpiles, it is necessary, however,
to keep in mind that the loss in the throughput of a system with one stacker and one reclaimer will be
smaller than that of the system with two stackers and two reclaimers due to the time spent on
changing over. Another fact is that the shorter the average change-over time of stackers/reclaimers,
the better the utilisation of the new incline conveyor C5 will be.
A further decrease in material production in scenario 3 is explained by the fact of shutting down
conveyor Cl and re-routing material coming from the new overland conveyor C6 directly to the transfer
tower while there was no feed into plant 1. When Cl was stopped, it didn't deliver any material into
the system, which contributed to the loss in production.
Performance parameters of conveyors are broken down in Table 6. The overall best utilisation of
conveyors was observed for scenario 1 with 2 x 40,000 t stockpiles, which fully correlates with the
results of material production.
Table 6. Results of simulation of conveyors
Scenario |
Code |
Volume |
Avg
Time
in Syst |
Percentage of
Time |
In |
Out |
Curr
In |
Avg
In |
Down
Time |
Idle |
Flow-
ing |
Off-
Shift |
1:2 x 20,000 t |
C1 |
9,783,150 |
9,782,940 |
205 |
205 |
9 |
0.00 |
5.65 |
94.35 |
18.63 |
| C5 |
9,055,130 |
9,054,980 |
150 |
147 |
4 |
0.00 |
7.71 |
92.29 |
53.79 |
| C6 |
9,054,980 |
9,054,980 |
0 |
314 |
15 |
0.00 |
52.38 |
47.62 |
18.63 |
| C2 |
8,199,040 |
8,199,040 |
0 |
9 |
0 |
0.00 |
64.96 |
35.04 |
18.63 |
| C3 |
16,372,200 |
16,372,200 |
22 |
16 |
0 |
0.00 |
26.94 |
73.06 |
18.63 |
| C7 |
0 |
0 |
0 |
0 |
0 |
0.00 |
100.00 |
0.00 |
18.63 |
| C8 |
0 |
0 |
0 |
0 |
0 |
0.00 |
100.00 |
0.00 |
18.63 |
| C9 |
10,587,700 |
10,587,600 |
100 |
96 |
4 |
0.00 |
3.34 |
96.66 |
18.63 |
| C4 |
8,259,220 |
8,259,120 |
100 |
97 |
5 |
0.00 |
3.29 |
96.71 |
18.63 |
1:2 x 40,000 t |
C1 |
10,361,100 |
10,360,900 |
205 |
205 |
8 |
0.00 |
0.08 |
99.92 |
18.63 |
| C5 |
9,834,350 |
9,834,200 |
150 |
147 |
4 |
0.00 |
0.04 |
99.96 |
53.79 |
| C6 |
9,834,200 |
9,834,200 |
0 |
288 |
13 |
0.00 |
46.47 |
53.53 |
18.63 |
| C2 |
9,356,300 |
9,356,300 |
0 |
10 |
0 |
0.00 |
55.85 |
44.15 |
18.63 |
| C3 |
18,859,800 |
18,859,700 |
22 |
19 |
0 |
0.00 |
14.66 |
85.34 |
18.63 |
| C7 |
0 |
0 |
0 |
0 |
0 |
0.00 |
100.00 |
0.00 |
18.63 |
| C8 |
0 |
0 |
0 |
0 |
0 |
0.00 |
100.00 |
0.00 |
18.63 |
| C9 |
13,072,100 |
13,072,000 |
100 |
95 |
3 |
0.00 |
4.63 |
95.37 |
18.63 |
| C4 |
7,144,510 |
7,144,410 |
100 |
85 |
5 |
0.00 |
14.04 |
85.96 |
18.63 |
2 |
C1 |
8,559,960 |
8,559,750 |
205 |
205 |
10 |
0.00 |
16.53 |
83.47 |
18.63 |
| C5 |
9,572,030 |
9,571,880 |
150 |
147 |
4 |
0.00 |
2.24 |
97.76 |
53.79 |
| C6 |
9,574,880 |
9,574,880 |
0 |
292 |
13 |
0.00 |
47.82 |
52.18 |
18.63 |
| C2 |
4,024,580 |
4,024,580 |
0 |
11 |
1 |
0.00 |
61.09 |
38.91 |
18.63 |
| C3 |
8,062,220 |
8,062,200 |
22 |
22 |
1 |
0.00 |
5.67 |
94.33 |
18.63 |
| C7 |
9,574,880 |
9,574,880 |
0 |
17 |
1 |
0.00 |
50.80 |
49.20 |
18.63 |
| C8 |
9,594,880 |
9,594,640 |
236 |
160 |
7 |
0.00 |
30.53 |
69.47 |
18.63 |
| C9 |
9,594,640 |
9,594,440 |
200 |
136 |
6 |
0.00 |
30.80 |
69.20 |
18.63 |
| C4 |
8,554,040 |
8,553,940 |
100 |
100 |
5 |
0.00 |
0.00 |
100.00 |
18.63 |
3 |
C1 |
8,315,082 |
8,314,978 |
205 |
202 |
10 |
0.00 |
17.34 |
82.66 |
18.63 |
| C5 |
7,191,705 |
7,191,601 |
150 |
147 |
5 |
0.00 |
16.13 |
83.87 |
53.79 |
| C6 |
7,193,050 |
7,192,843 |
403 |
350 |
21 |
0.00 |
49.45 |
50.55 |
18.63 |
| C2 |
4,031,440 |
4,031,440 |
0 |
11 |
1 |
0.00 |
61.04 |
38.96 |
18.63 |
| C3 |
8,065,862 |
8,065,862 |
22 |
21 |
1 |
0.00 |
5.65 |
94.35 |
18.63 |
| C7 |
6,685,812 |
6,685,812 |
0 |
20 |
1 |
0.00 |
55.38 |
44.62 |
18.63 |
| C8 |
6,693,214 |
6,693,110 |
236 |
112 |
7 |
0.00 |
49.91 |
50.09 |
18.63 |
| C9 |
8,601,982 |
8,601,930 |
100 |
100 |
5 |
0.00 |
0.00 |
100.00 |
18.63 |
| C4 |
6,913,500 |
6,913,448 |
27 |
49 |
3 |
0.00 |
49.53 |
50.47 |
18.63 |
The utilisation of conveyor C8 in scenario 2 is rather worse than that of C3. This indicates that the
operation of the new stacker and reclaimer was less efficient that of the existing ones. The reason for
that could be the size of the new stockpiles, which caused the stacker and reclaimer to move more
frequently than in the existing stockyard (compare 16.7 hours required to reclaim the full old
stockyard to 12.5 hours to reclaim the full new one).
In scenario 3 the situation reversed: conveyor C4 performed better than C9 due to the preferential
feed of the former (remember, the control algorithm had an objective to maintain uninterrupted feed
to plant 1).
Parameters of the stockpiles and bunkers are summarised in Table 7.
Table 7. Results of simulation of storage facilities
Scenario |
Name |
Volume |
Avg
Time
in Sys |
Percentage of Time |
Entered |
Shipped |
Curr
In |
Avg
In |
Empty |
Full |
Partly
Full |
Off-
Shift |
1:2 x 20,000 t |
Bunker 2 |
9,054,980 |
9,054,980 |
0 |
1,522 |
72 |
46.52 |
6.76 |
46.72 |
18.63 |
S/pile 1/1 |
8,167,680 |
8,167,330 |
342 |
7,742 |
405 |
13.73 |
5.21 |
81.06 |
18.63 |
S/pile 1/2 |
8,219,040 |
8,204,920 |
14,119 |
7,811 |
406 |
14.16 |
5.27 |
80.56 |
18.63 |
S/pile 2/1 |
0 |
0 |
0 |
0 |
0 |
100.00 |
0.00 |
0.00 |
18.63 |
S/pile 2/2 |
0 |
0 |
0 |
0 |
0 |
100.00 |
0.00 |
0.00 |
18.63 |
Bunker 1 |
8,259,340 |
8,259,220 |
118 |
126 |
7 |
6.76 |
0.00 |
93.24 |
18.63 |
1:2 x 40,000 t |
Bunker 2 |
9,834,200 |
9,834,200 |
2 |
706 |
31 |
56.73 |
0.03 |
433.24 |
18.63 |
S/pile 1/1 |
9,485,000 |
9,468,210 |
16,792 |
12,150 |
548 |
7.42 |
0.13 |
92.45 |
18.63 |
S/pile 1/2 |
9,396,300 |
9,391,570 |
4,730 |
12,179 |
554 |
8.08 |
0.01 |
91.91 |
18.63 |
S/pile 2/1 |
0 |
0 |
0 |
0 |
0 |
100.00 |
0.00 |
0.00 |
18.63 |
S/pile 2/2 |
0 |
0 |
0 |
0 |
0 |
100.00 |
0.00 |
0.00 |
18.63 |
Bunker 1 |
7,145,140 |
7,144,510 |
625 |
320 |
19 |
61.65 |
0.00 |
38.35 |
18.63 |
2 |
Bunker 2 |
9,574,880 |
9,574,880 |
0 |
914 |
41 |
55.32 |
1.95 |
42.73 |
18.63 |
S/pile 1/1 |
4,040,000 |
4,020,000 |
20,000 |
10,831 |
1,147 |
2.15 |
11.12 |
86.73 |
18.63 |
S/pile 1/2 |
4,044,580 |
4,042,240 |
2,343 |
10,826 |
1,145 |
2.18 |
11.11 |
86.71 |
18.63 |
S/pile 2/1 |
4,125,140 |
4,125,140 |
0 |
4,996 |
518 |
34.67 |
0.06 |
65.27 |
18.63 |
S/pile 2/2 |
5,474,740 |
5,469,730 |
5,005 |
6,065 |
474 |
25.54 |
0.02 |
74.44 |
18.63 |
Bunker 1 |
8,560,970 |
8,554,040 |
6,925 |
6,753 |
337 |
0.00 |
10.90 |
89.10 |
18.63 |
3 |
Bunker 2 |
7,193,154 |
7,193,050 |
167 |
1,854 |
110 |
39.25 |
18.43 |
42.33 |
18.63 |
S/pile 1/1 |
4,035,969 |
4,026,849 |
17,624 |
10,789 |
1,144 |
2.85 |
10.95 |
86.19 |
18.63 |
S/pile 1/2 |
4,041,792 |
4,039,049 |
5,301 |
10,792 |
1,142 |
2.89 |
10.95 |
86.17 |
18.63 |
S/pile 2/1 |
3,349,174 |
3,349,097 |
154 |
4,734 |
605 |
34.01 |
0.08 |
65.91 |
18.63 |
S/pile 2/2 |
3,349,573 |
3,344,133 |
10,506 |
4,626 |
591 |
34.97 |
0.04 |
64.99 |
18.63 |
Bunker 1 |
6,913,552 |
6,913,500 |
88 |
52 |
3 |
54.37 |
0.00 |
45.63 |
18.63 |
3.4. Throughput of the Plants
It is interesting to note that with much better throughput of plant 1 in scenario 2 with 2 x 40,000 t
stockpiles, the productivity of plant 2 scaled down by some 15%. In scenario 2, both plants performed
very similarly, although plant 1 was supposed to process more material. The only obvious reason for
that could be less efficient operation of the new stacker and reclaimer as discussed in Section 3.3.
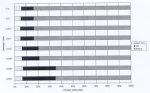
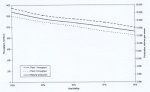
Overall material production and plant throughputs versus equipment availability are plotted in
Figure 11.
Figure 11. Effect of equipment availability on production
and throughput of
material
3.5. Recommendations from the Case Study
As a result of simulating experimentation, the following conclusions can be made:
- The absolute maximum number of underground sections that can mine and feed material into the new
surge bunker concurrently is 11, with the capacity of the new incline conveyor of 3,600 t/h.
- The new surge bunker sized at 5,000 t will be able to accommodate the irregularity of the feed
coming from the underground mining operation.
- A capacity of the new overland conveyor of 3,000 t will suffice to deliver the amount of material
required for the plants and to balance the feed coming into the surge bunker with the above two
recommendations followed.
- The existing stockyard at its current capacity of two stockpiles of 20,000 t each will maintain
the annual production of material exceeding 18 million tons and sufficient throughput of the material
plants at 100% availability of equipment if the capacity of the existing stacker can be upgraded to
4,500 t/h and of the reclaimer to 3,200 t/h.
- The stockyard with two new stockpiles of 25,000 t each, a new stacker of 3,000 t/h, a new
reclaimer of 2,000 t/h and associated conveyors will also provide the production of material of more
than 18 million tons per annum and a sufficient feed through the plants with no breakdowns in the
system.
- If the availability of equipment degrades to 85%, a loss is expected of ±4 million tons of
annual production of material, from 18 million to 14 million tons.
4. References
- Sturgul, J. R. 1995. "Simulation and Animation Come of Age in Mining." Engineering and
Mining Journal, October 1995.
- Rasche, T. and Sturgul, J. R. 1991. "A Simulation to Assist a, Small Mine: A Case
Study." International Journal of Surface Mining (Holland), 1991, No. 5, p. 123-128.
- Sturgul, J. R. 1997. "History of Discrete Mine System Simulation." MineSim'96, First
International Symposium on Mine Simulation via the Internet. National Technical University of
Athens, Greece, December 3-13.1996, published by A. A. Balkema Publishers (Holland), 1997.
- Sturgul, J. R. 1996. "Annotated Bibliography of Mine Simulation 1961 -1995," MineSim '96, First
International Symposium on Mine Simulation via the Internet.
- Kalansky, D. R. and Mutmansky, J. M. 1996. "Computer Simulation in the Mineral Industries:
Analytical and International Trends. " Proceedings of 26th APCOM - Application ofcomputers and
Operations Research in the Mineral Industry, September 16-20, 1996.
- Lebedev, A. 1998. "Simulation Modeling in Bulk Conveying Systems." SIMULATION, vol. 70, no.
2, pp 90-103, February 1998.
|
ALEXANDER A. LEBEDEV received
MSC (Cum Laude) and PhD degrees in metallurgical engineering from the Moscow Institute of Steel
and Alloys in 1982 and 1987, respectively. He specialised in thermal physics and process control
and instrumentation. Before he relocated to South Africa, his scientific interests concentrated
on application of computer modelling to heat transfer and process control. He is currently
employed as a senior consultant with Xcel Engineering and Management, a South African industrial
engineering consulting firm, and is actively involved in systems engineering and simulation
modelling of large industrial systems. He is a registered Professional Engineer. |
|
PHILLIP STAPLES graduated with a
BSc degree in Mechanical Engineering from the University College, Swansea, United Kingdom. For
the past 22 years, he has been working in South Africa designing high-tech conveying systems and
stacker reclaimers for the coal and base metal industries. He operates as a consultant in his
own company, Conveyor Dynamics Africa, which also represents CDI (the U.S.-based conveyor dynamics
company) in southern Africa. Over the years Mr. Staples has been a pioneer in the use of
sophisticated simulation techniques to optimize both conveyors and stockyard equipment. The
results of his efforts have helped increase the performance of the mines concerned. He is a
registered Professional Engineer. |
|