|
 |

![]()
![]()
![]()
![]()
![]()
![]()
![]()
![]()
![]()
![]()
![]()
![]()
|
|
|
INDO
GULF COPPER SMELTER PIPE CONVEYOR P.
Staples and A.K. Mehta, India
In
a continuing effort to remove the fears surrounding the use of pipe conveyor
technology as an alternative conveying option, the writers have revisited the
Indo Gulf pipe conveyor operation, (in India), to assess what can be learned
from the present operation and the improvements that can be made for future
development of the concept. The
3,2 km pipe conveyor at Indo Gulf has by and large been considered a triumph for
the pipe conveyor industry as a whole. This
development has proved conclusively that there is a place for the pipe conveyor
in an environmentally conscious society and that we are far from reaching the
limits of its length and capacity. There
was also a lot of skepticism that it was possible to develop the 90-degree
horizontal curve, which was proved to be possible. However,
where attentions to alignment, level and component installation accuracies are
not significant on conventional conveyors, pipe conveyors must be installed to a
far higher degree of alignment accuracy to counter the tendency the carry has to
twist especially for the empty belt. The
Indo Gulf pipe conveyor has now been operational for 1½ years and there is much
to be learned from its present performance, with the aim of identifying
performance shortfalls, possible operating improvements, and measure the actual
power used and arrive at an accurate operating cost model. Also
as the pipe conveyor has experienced some operational problems it is interesting
to identify the cause and effect of such problems. The
main areas of concern are : -
2.
System Overview Prior
to entering into the problem areas of the conveyor we will detail the conveyors
basic parameters. Conveyor
Specification
Table
1 & 2 indicates the actual power consumption for the various offloading
capacities and the amount of material conveyed in its initial operation. Table
1 Power Consumption
Table
2 Material Handled
The
justification for the pipe conveyor was based on both an environmental sensitive
and cost analysis when compared against alternative options of 2 belt conveyors
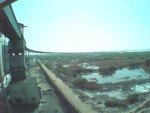
with a transfer point. Figure
1 shows an environmentally sensitive area that had to be circumvented requiring
either a curved conveyor or a conventional conveyor with a transfer point. The
transfer point was considered unacceptable because of the high cost of the
materials being conveyed and the damage spillage could cause to the environment. An
open troughed belt could not negotiate the tight curve and would have been
susceptible to wind blown dust. Figure
1: View of the wet land that had to
3.
Operational Problems During
our latest inspection, we noticed a number of operational problems, which we
considered needed addressing to achieve an acceptable system. None
of the items in themselves adversely affected the operating performance of the
conveyor, however it was felt that prior to bringing the conveyor up to full
design capacity and for information for future projects, one should at least be
able to identify the reasons for the problems, and where practical, effect
modifications which would eliminate them. 3.1
Erratic belt movement (twisting) This
observation was initially made at the commissioning stage of the conveyor. It
was seen that three belt sections, (of the 30 installed), caused the belt to
rotate when empty by almost 180 degrees in the carry strand primarily along the
straight section. When
entering the curve the belt would correct itself and run correctly through to
the discharge pulley. The return strand ran, perfectly throughout its length,
with the overlap on the bottom roll. The
conveyor is equipped with training idlers, but because the movement was confined
to only 10% of the belt, correction to the bad sections resulted in movement to
the good sections. As
it was not apparent why the belt sections caused the belt to twist, it was
decided to compromise the belt twist and set the empty belt to move between
–30 degree and +45 degree about the vertical center line through its length. After
1 years operation we were informed that the belt was behaving worse than
initially and that we should investigate the matter further. To
identify the reasons for the erratic movement, and to locate the problem
sections of belt. A series of inspections and tests were conducted at site. The
first test performed was intended to verify that the belt sections were
constructed correctly and that there was no bow in the belt. A set of alignment
arms (tilt switches) were positioned either side of the belt in a flat straight
portion, then a simple pen recorder indicated the movement and misalignment of
the belt. It
can be seen from the graph figure 2 that generally there is no clearly
identified belt section causing alignment problems, the belt ran between +/-
20mm throughout its length with round 3 producing some bigger variations at
sections 5,6,7 and 20,21,22. Graph
figure 2 shows the movement of the belt over
A
second test conducted in the splices set out to prove the correctness of
alignment of each splice. Here
only one splice was out of tolerance and was remade. However, this had no effect
on the belt performance. Having
eliminated the possible problems with belt manufacture and splice construction
we considered the possible problems associated with the way the pulling of the
belt into the structure was carried out. In
past years little has been written about the effects of installing the belt in
the correct sequence, in fact little or no literature exists about the problems
that could occur with incorrectly installed belt. Figure
3 Splice procedure and sequence
When
one considers the pipe conveyor and the problems of carry strand empty belt
stability then the procedure of belt installation was revisited. The
procedure followed for belt pulling and splicing the belt sections was shown in
figure 3 above, which indicates that the belt was pulled into the top and bottom
strands with alternating splicing between the strands. This
allows us to pull the belt into one strand while splicing in the other strand,
which was done to expedite the construction which had been delayed by the
extended jetty construction phase with the final splice being carried out at the
tail. Today
convention dictates that to counter cable tensing problems during belt
construction, the belt should be pulled onto the conveyor in the same way as it
is constructed. Therefore
it is necessary to ensure that the procedure of rolling the belt during
manufacture is repeated during installation. Again referring to figure 3, we see
that splice 14 and 30 were made end-to-end and start-to-start respectively.
Therefore if there were any variations in cable tension, these would be
amplified in the way the belt was installed. To
confirm this possible problem a further belt inspection was carried out by the
writers, which made it possible to confirm that as indicated in figure 3, two
splices were in fact end-to-end and start-to-start (splices 30 & 14) and a
third splice (19) was also incorrect. The
reason for splice 19 being turned around cannot be fully explained, however it
was noted that during belt inspection at the factory one belt was re-rolled
because it was not correctly packed. The re-rolling procedure would also have
the effect of reversing the belt. Highlighting
this type of problem, which was not anticipated at the time of installation, has
given us an answer to the cause of the problem. Therefore it has been concluded
that it could be necessary to reverse those belt sections to eliminate the
erratic belt movements in the carry side. At
the time of writing this modification has not been carried out, in fact as the
problem only occurs on the empty belt it may be possible to allow the belt to
stay as it is for the foreseeable future. Possibly carrying out the change when
a replacement belt has to be installed. However
what this problem has highlighted is the degree of sensitivity experienced by
the pipe belt and the lengths one must go to, to ensure an accurate installation
because carry belt stability is very difficult to guarantee. The
pipe belt construction cannot be considered as very forgiving for structural
alignment, or variations in belt construction, which makes us very concerned
about specifying a replacement section of belt that will perform correctly in an
existing installation, especially if that section is supplied by an alternative
belting manufacturer. 3.2
Load Sharing Between Drives The
conveyor is presently operating with 2 of the 3 drives because the carrying
capacity is dictated by the ship off loader, which is set at 910tph. When
the second ship off loader is commissioned the third drive will be added to load
up to 1850 tph. When
running the two drives the tail drive has to be derated to avoid slip. Investigation
shows that the return belt is absorbing 20% less power than initially
calculated. Inspection
shows throughout the straight portion of the return length, the belt only
contacted the lower three rolls of the return set, asking the question of why
the other three rolls were installed in the first place. Generally
the belt is running at 90% of its actual diameter along this section. This
section is almost horizontal and the tensions are reasonable low in this area,
the question is asked why the smaller diameter. Review
of the original profile in relation to the preset profile leads the writers to
postulate that the reasons for this phenomena is the relationship between belt
mass and sliding friction between the overlapping belt sections. This
phenomenon is currently being studied and is the subject of a future paper to be
written on the subject and will not be touched upon in this paper. However
this dose answers the question of reduced tension in the return strand and
therefore the inability of the tail drive to share power correctly. The
solution to this problem is either to increase the return belt tension by
increasing the take up tension or replacing the tail drive with the proposed
future secondary drive at the head station. 3.3
Reduction of Return Belt Diameter Prior
to leaving this subject of pipe redirection as identified in the previous
section, the writers would like to take this opportunity to address the problem
of cause of pipe collapse, or diameter reduction on many other installations. Figure
4 shows the reduced return belt diameter
During
the past 3 years a number of installations have been visited to investigate
similar problems often resulting in premature belt failure. Without exception
the blame has been leveled at the belt construction and also without exception
after inspection the reasons for these failures can be attributed directly to
the conveyor layout, and always the problem of inadequate vertical or horizontal
curve radii. Reviewing
the design procedure of many proprietary suppliers of such systems clearly
indicates the reasons for such problems. Little or no attention is actually
given to the forces present in the design of the curve and subsequently belt
failure at these junctures. When
one considers the conveyor, which is the subject of this paper and the degree of
attention paid to the curve design, one understands that almost all belt
failures are a result of inadequate curve design. To
expand on this critical issue of curve design, we would like to explain the
procedures followed in selecting the correct cross belt rigidity factor which
would ensure that the belt at Indo Gulf would not buckle in the curves. As
there was no published literature available in the degree of rigidity necessary
to ensure the belt would not buckle, and we were operating in the area of
uncertainty when one considers that we were constructing a 90deg high-tension
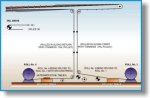
curve we decided to test a section of the belt in the laboratory. A
10m section of the proposed structure was built, refer to figure 5, and an
actual section of the proposed belt, manufactured to our anticipated
requirements, was installed in the structure. Figure
5 Belt buckling test rig
The
structure was designed to form the required radius and the belt was then
tensioned to the operating limits. As
the tension was applied, the indentation measurements were taken at one
of the idler rolls. These tests were repeated at various smaller radii to ensure
there would be no chance of buckling, and that the construction was in fact
safe. Obviously it would have been more accurate to conduct the test on a moving
pipe, but this was not practical. As
a result of the experiment, it was possible to be confident that the belt as
tested would not buckle at the radius selected and it was a simple exercise from
this point to measure the actual belt rigidity factor which could be used to
ensure the correct construction of the total belt (Refer graph figures 6-9) and
which was used to test the belt during the actual manufacture. During
the operation of the conveyor there has been no observed pipe collapsing, except
the reduction in diameter noted above. As
this reduction in diameter in a straight section of the conveyor has not been
explained at this time and as this does not affect the conveyor performance and
results in a lower power usage then one is tempted to ignore it. However
as it is our hope for the future that we will be able to push pipe conveyors to
the lengths traveled by conventional conveyors we must be able to give an
explanation for this effect. Figure
6 Graphed deflection readings
Figure
7 Graphed deflection readings
Figure
8 Longitudinal Tension Test
Figure
9 Transverse Tension Test
To
this end we are embarking onto a research project to assist in identifying the
cause and procedure of eliminating or predicting the effect thus being able to
offer a more efficient design. 3.4
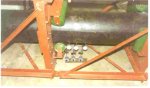
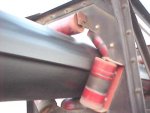
Idler Wear in Return Strand Curve
This
problem was identified through the vertical curve and was caused by the belt
edge pressing hard into the roll. The
problem was more prevalent at the top of the curve and diminished as we advanced
down the curve. The cause of the problem is obviously a function of the belt
edge rubbing into the roll with high pressure at the top of the curve and thus
diminishes as the tension reduces. Figure
10 shows the problem and to overcome this problem it is necessary to change the
overlap of the return belt so that the overlapped edge is on the inside of the
belt on the inside of the curve. 3.5
Pipe Belt Feeding Chute This
problem which is typical of pipe conveyors and therefore critical that it is
resolved results in the belt moving horizontally in the loading point and thus
reducing the effectiveness of the pipe forming section. The
design of the chute was such that the loading was based on 1850 tph and when
operating at the lower capacities the load shape impinged on the side impact
idler and pushed the belt off line. There
it can be seen that when one has variable loading conditions, the belt tends to
be pushed down the inclined troughing idler and thus the belt is misaligned as
it starts the pipe forming. To
overcome this problem we have introduced a completely redesigned feed chute,
which incorporates a number of improved features. 4.
Optimization of Capacity & Speed related to Power Cost As
the cost of power in India is very high, an optimization procedure has been
undertaken to lower the total system operating cost. By
running the conveyor at an optimum speed for the various materials and
capacities, we consider that we will be able to lower the overall operating
cost.
|
|
Send mail to Webmaster with
questions or comments about this web site.
|