Application of Simulation to
Selection of Ore Haulage System
A. Lebedev and P. Staples, Republic of South Africa
Summary
Application of dynamic simulation to selecting underground ore haulage system is discussed. Five
alternative schemes were modelled three mobile equipment options, a continuous rope system and
conventional conveyors. The objective was to accurately size each of the options for further financial
evaluation and final selection.
1. Introduction
In previous paper [1] the authors discussed how simulation modelling can be applied for the design
of an ore handling system in an underground mine, and what benefits can be produced out of it. The
battery limits of that model were the ROM bunkers in the front and surface stockpiles in the back. The
model discussed in this paper covers the following alternative systems to haul ore from orepasses to
the ROM bunkers, installed at the underground crusher station:
- Mobile equipment
- Diesel 50 t trucks
- Diesel 25 t trucks
- Electric 35 t trucks
- Fixed equipment
- Continuous rope ('Railhugger')
- Conventional conveyor
The orebody will be mined in two directions further referred to as the Northern and Southern haulage
routes with approximately 350 m spacing between the orepasses as shown in Fig. 1.
Fig. 1: Map of the ore and haulage routes with Location
of orepasses
2. Initial Data and Assumptions
The following data were used for the definftion of the baseline worst-case simulation scenario:
- One grade of ore can be mined in a shift in each of the haul routes.
- Different grades of ore are mined in Northern and Southern portions of the ore body within the
same shift and no contamination can be allowed for. The crusher separately processes ore originating
from Northern and Southern routes.
- Ore is always available and the orepasses are never empty.
- Since two ore haulage routes will be operated concurrently, a total of four ROM bunkers were
allowed for, two per route. However, scenarios with only one bunker available for tipping per route
were simulated for mobile equipment options, to analyze the effect of traffic congestion.
- Mining in one route only was simulated as well to check the throughput and flexibility of
production.
- Mining takes place in the furthest points in both haul routes
- Trucks drive laden up the ramp at 12.28% (7°) and empty down the ramp.
- Trucks cannot overtake each other, and two separate driveways for driving up and down were
allowed for.
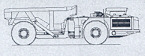
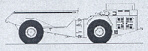
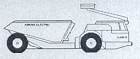
- Parameters of mobile equipment are summarised in Table 1.
| Description |
Toro 50 |
EJC 530 |
Kiruna Electric |
| Image |
|
|
|
| Average payload [t] |
50.00 |
25.00 |
35.00 |
| Laden speed [km/h] |
7.29 |
10.50 |
16.08 |
| Empty Speed [km/h] |
30.00 |
30.00 |
20.00 |
| Accelerate time [min] |
1.20 |
1.50 |
included |
| Decelerate time [min] |
1.20 |
1.50 |
Included |
| Loading time [min] |
1.00 |
0.50 |
0.70 |
| Tipping time [min] |
0.30 |
0.30 |
1.00 |
| Planned downtime [%] |
10.00 |
10.00 |
10.00 |
| Assumed MTBF [h] |
24.00 |
24.00 |
24.00 |
| Assumed MTTR [h] |
2.60 |
2.60 |
2.60 |
Table 1: Parameters of mobile equipment
- No standby mobile equipment was allowed for.
- If a vehicle breaks down, it is removed to a workshop where it spends time equivalent to Mean
Time to Repair (MTTR).
- Random variations sampled from appropriate distributions were applied to the actual payload
value, travel speeds, loading/unloading durations and MTBF/MTTR values.
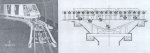
- Continuous rope haulage system ('Railhugger') comprises tracks installed in both ore haulage
routes and trains each consisting of six cars, pulled by a winch and a rope (see Fig. 2).
Fig. 2: Concept of the continuous rope system and a scheme
of ore unloading
hopper
- The parameters for one- and two-train configurations in a loop are summarised in Table 2.
| Description |
One Train |
Two Train |
| Payload per cycle [t] |
90.0 |
180.0 |
| Accelerator time [min] |
0.15 |
0.15 |
| Laden speed [km/h] |
19.8 |
19.8 |
| Empty speed [km/h] |
19.8 |
19.8 |
| Decelerate time [min] |
0.15 |
0.15 |
| Load time [min] |
1.83 |
1.83 |
| Unload time [min] |
0.66 |
1.83 |
| Availability [%] |
85.0 |
85.0 |
Table 2: Parameters of continuous rope haulage system
- Conveyor parameters are summarised in Table 3.
| Area |
Belt No. |
Speed [m/s] |
Capacity [t/h] |
Length [m] |
| Northern |
11
12
13
14
15 |
1.3
1.3
1.3
1.3
1.3 |
650
650
650
650
650 |
600
600
600
480
180 |
| Southern |
21
22
23
24 |
1.3
1.3
1.3
1.3 |
650
650
650
650 |
600
600
600
180 |
Table 3: Conveyor parameters
- The availability of each of the conveyor belts was assumed 96%.
3. Overview of the Models
All models were built using witness simulation software. Animation screenshot of the model simulating
ore haulage with mobile equipment appears in Fig. 3.
Fig. 3: Animation screenshot of the ore haulage with mobile
equipment model
In the mobile equipment model, up to six trucks can be allowed for per haul route. Trucks arrive to
the ore-pass loading feeder and are delayed for the loading duration. Once a truck has been loaded
according to the actual payload, it starts travelling at a laden speed up the ramp to the crusher
station. Acceleration and deceleration are simulated in Witness as a time delay equivalent to a
half of the specified accelerating/decelerating time, assuming that the speed accelerates and
decelerates as a linear function of time.
Once the truck arrives to the crusher station, it is delayed for the unloading duration, and
then it leaves the crusher and travels down the ramp at an empty speed. Once the running hours of a
truck exceed the current MTBF value, the truck is removed from the loop and placed in the workshop
for the duration of the current MTTR value (MTBF and MTTR are sampled with the initialization of the
model and each time a truck breaks down).
Animation screenshot of the model simulating ore haulage with continuous rope appears in Fig. 4.
A continuous rope ore haulage system was simulated as a Section-Powered Network, where 'sections' act
similar to a chain conveyor with 'hooks' (or 'dogs') attached. The hooks on the section pick up
'carriers' (trains in this specific instance) and move them along to the unloading station. After
unloading has been finished, the return section picks up an empty carrier (train) and moves it back
to the loading station. In the event of using more than one carder in a specific section, a 'dog
spacing' can be defined, which in this model was equal to the complete length of the haul track. For
example, if one train is busy loading then the other one is unloading, while moving trains are
always situated equidistantly from the track ends.
In Fig. 4, an empty train represented with a white block has reached the loading station in the
Southern haul route, while in the Northern haul route a laden train (solid black block) is approaching
the unloading station and the empty one is approaching the orepass.
Fig. 4: Animation screenshot of the continuous rope ore
haulage model
Animation screenshot of the model simulating ore haulage with belt conveyors appears in Fig. 5.
Fig. 5: Animation screenshot of the conveyor ore haulage model
(belt 52
broken down)
This is a standard conveyor system model, what needs to be mentioned is a system availability of
the two chains consisting of multiple units: 82% and 85% for the Northern and Southern routes,
respectively.
4. Results of Simulation Modelling
For all mobile equipment options, trucks were deployed equally between Northern and Southern haul
routes regardless of the truck type and size. Since no standby units were allowed for, the results
achieved for the mobile fleet were based on the actually available trucks.
The requirements for the fleet size for various truck options are shown in Fig. 6.
Fig. 6: Total fleet size requirements depending on
mine production
Although the size of Kiruna 35 t electric trucks is 30% smaller than of Toro 50, the same number of
vehicles was sufficient to achieve the production target. Due to a higher laden speed (see Table 1),
the complete cycle time of the electdc truck is approximately 36% shorter than of a 50 t diesel one,
allowing for more cycles to be done within the same period of time.
A second bunker available for tipping ore per route did not produce any significant impact on the
throughput of the mine in the considered range of the fleet sizes. For example, with six vehicles
deployed per haul route, the improvement in performance with two ROM bunkers was only 2%. The
explanation to that is a low frequency of tipping, when the probability of arriving more than one
truck at a time was negligible.
Two continuous rope haulage systems were allowed for in the mine, one in the Northern route and one in
the Southern route. It was found through simulation experiments that with only two trains hauling
ore (1+1 scheme) it was impossible to achieve the required tonnage. The explanation to that is an
introduction of random variation to the dynamic model resulting in imperfect sequencing of events
compared to a static model based on constant values as was done in up-front capacity panning.
However by adding a second train to the Northern loop, a reduction in the train speed became possible
potentially presenting an opportunity to save costs on the drive size and power consumption. Instead
of 5.5 m/s as per the manufacturer's specification, trains in both haul routes could be operated at
4.2 m/s (a 24% reduction) still meeting the production target.
With many attractive features of the continuous rope ore haulage system including low operating and
maintenance costs, it needs to be noted that it was the least flexible system of all considered. For
example, if a surge demand in a specific ore grade available in only one part of the ore body occurred
(regardless North or South), the only two ways to upgrade the throughput of the system, if technically
feasible, were:
- Adding more cars to the train (originally 6 units per train);
- Increasing travel speed.
The first option is a major mission to accomplish if practically possible at all, involving
disassembly of the trains in both haul routes, relocation of the cars, re-assembly, adjusting the
rope, etc. The second option seems more practical should the drives, the winch and the track be
designed for the higher speed from the very beginning.
As far as conventional conveyors were concerned, with two conveyors running in parallel, a 300 t/h
discharge rate from each of the orepasses would ensure sufficient tonnage delivered to the crusher.
Since the belts were sized at 650 t/h, there was a substantial safety factor allowing for a high
flexibility of the operation, including meeting the production needs by servicing one haul route
only.
5. Conclusions
For all the alternative ore haulage options considered, technical comparison was made and capacity
requirements were quantified for the future input into a financial model to determine the most
economically feasible solution. On the technical level, all five alternatives examined were
capable to meet the production target of the mine.
It was also established once again, that capacity planing using static techniques (for example,
spreadsheets) did not produce accurate results with errors spreading sideways, oversizing some
of the options and undersizing the others. Dynamic simulation is an answer to cater for randomness
of the real world and one-to-many relationships occurring in mining operations.
References
- LEBEDEV, A. and STAPLES, P.: Simulation benefits underground mine infrastructure design; bulk
solids handling, Vol. 20 (2000) No.2, pp. 191 196.