Dynamic Analysis of Belt Conveyors
Philip Staples, Pr Eng BSc FIMH
Dynamic analysis is the new buzz-word in the design of belt conveyors. What are the uses - and the
abuses - of this science of analysing belt conveyors correctly. By removing the mystery surrounding
this comparatively new technique, we hope to encourage its use in major belt conveying projects in
the future.
WHAT 1S DYNAMIC ANALYSIS
For simple conventional belt conveying systems there are many well documented procedures to calculate
required powers, tensions and other factors. With the assistance of computers, this rigid body analysis
has been successfully streamlined, allowing the designer to concentrate on the problems of chute
design, drive house layouts and components of manufacture.
However, with the growing need for larger, longer conveying systems, there is a need to refine the
analysis procedures. Generally, when conveying systems are analysed as rigid bodies in a stationary
state, the effects of boundary conditions - starting and stopping - are ignored.
Dynamic Analysis is a computer simulation of the properties and performance of the system in motion -
an analysis of the starting and stopping characteristics of a belt conveyor.
EXPLAINING DYNAMIC ANALYSIS
During steady state running..
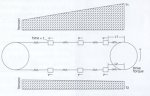
Figure 1 shows a simple conveyor system during steady state running, modelled as a series of masses
and springs. In a steady state condition, the spring extension before the drive (L1) and after the
drive (L2) remain constant. In the steady state condition, the torque due to the effective belt
tension on the pulley is matched by the torque produced by the drive.
FIG. 1 Mass-spring representation of
steady state running
The tension in the springs between the masses is determined by their stiffness and extension. Since
during steady state running, the distance between the masses (and the spring extension) remains
constant, the tension in the springs also remains constant.
After a coasting stop...
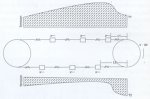
Figure 2 shows the same system, after the drive has been turned off.
- The removal of the drive torque from the pulley leaves the torque unbalanced. This results in a
rapid deceleration of the drive pulley from v to (v._v), so that the rim of the pulley moves a
shorter distance than do the masses adjacent to it.
FIG. 2 Mass-spring representation of
coasting stop
- This results in the shortening of the spring upstream of the pulley (with a resulting decrease in
tension) and a lengthening of the spring downstream and an increasing in tension.
- The change in tension on only one side of the masses adjacent to the pulley, subsequently
produces a force imbalance on these masses which causes them to decelerate.
- The deceleration causes changes in the extension and hence tension of the springs on the other
side of the masses. The resulting force imbalance causes the disturbance to propagate further along
the conveyor.
The resulting wave of decreased tension propagates down the carry side of the conveyor and a wave of
increased tensions propagates down the return side. For simplicity, the variations in tension will be
referred to as "compression" and "tension" waves. These labels are not entirely accurate, since it is
not possible to get true compression on a conveyor belt, but the terms are widely accepted.
If the magnitude of the "compression" wave is greater than the actual steady-state tension of a region
of the conveyor through which the wave passes, highly non-linear behaviour will result. The belt
tension in the region will not become negative but extremely low tensions and large belt sag between idlers will occur. Destructive dynamic
effects frequently result from this type of occurrence.
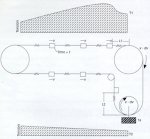
FIG. 3 Mass-spring representation of coasting stop
with gravity take-up
Coasting stop with gravity take up
Figure 3 is the same as Figure 2, except that a take-up is located immediately downstream of the
drive. The increase in tension downstream of the pulley, instead of inducing a tension wave, produces
a force imbalance on the take-up, causing it to accelerate upwards. This upward movement of the take
up, absorbs the "tension" wave. As a result, the return side of the belt is unaffected by the drive
stopping until the "compression" wave from the carry side has travelled completely around the
conveyor.
The speed with which the initial waves propagate is a function of the system mass and the belt axial
stiffness. The loaded side of the belt will be heavier and consequently waves on the carry side will
propagate more slowly than waves on the return side. Other important factors are the drive inertia and
the belt stiffness. The steady state velocity of the belt does not influence the magnitude of the
stress wave.
WHEN DO WE USE DYNAMIC ANALYSIS
There are no cut off points to dynamically analysing a conveying system. At present it is usual to
analyse large systems with complex profiles. Dynamic analysis tends to be introduced for conveyors in
excess of 1000m with capacities about 100 tph. This may be the norm, however any conveying system
experiencing large take-up movements or adverse shock wave propagation resulting in premature pulley
or drive failure, should fall into the spectrum.
It is often possible to identify dynamic problems in a conveyor when large movements of the take-up
occur. These movements are related either to elastic stretch in the belt, thus certain sections of
the belt moving at different speeds to other sections, or large quantities of belt being dumped
between the idlers causing a loss of tension, or a combination of these symptoms.
It has unfortunately become common practice to eliminate the symptom of take-up movement by "fixing it"
with a winch. This has the effect of making the design perform as a rigid body, and it must therefore
be over-designed to cater for the effects of wave propagation. Failure to
over-design, results in the
shock wave destroying pulley or drive components. Since this normally occurs in a progressive way
(fatigue), it does not always show itself as a dynamic problem.
BENEFITTING FROM DYNAMIC ANALYSIS
The advantages are generally seen in reduced costs and downtime. A dynamic analysis can give the
designer the confidence to reduce safety factors, thereby lower the specifications for belting and
allowing an increase in idlers spacing, thus reducing power use and component spares holding. It
should be noted that conveyors set up with dynamic analysis techniques are operating with a safety
factor for the belt of less than five.
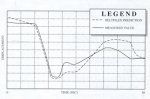
FIG. 4 A typical example of theoretical and actual readings. The take-up
movement
is an ideal test for model accuracy as it can be measured
in the field, giving substantial
justification for confidence
in the modelling.
CONCLUSION
Setting up a basic model, although very time consuming and highly complex, allows the designer greater
freedom in designing the system. A full analysis needs upward of 100 runs to satisfy all the possible
combinations of events. Today's computers require two hours to complete a single analysis, and a full
analysis would therefore take in the region of 200 working hours.
When the basic analysis has been concluded, and problems like shock wave propagation, excessive take
up or negative belt tensions have been identified, it is then possible to test various solutions. What
if a brake were installed. Where is the best position for a brake? Should we increase system inertia?
All these questions can be investigated.
Once this exercise has been completed, it is then possible to show the results of the full analysis
using computer simulated models which, through a time base, can display the operating parameters
allowing for the correct formulation of the control philosophy.
By using the simulation approach right from the design stage, the designer can advance the roll of
the conveyer to greater heights and lengths. Eliminating transfer points and pushing the conveyor to
higher speeds, knowing that he is not sacrificing safety, will ensure that the final system will
provide cost-effective bulk transportation for many years to come.