SIMULATION OF COAL MINE AND SUPPLY CHAIN
TO A POWER PLANT
ALEXANDER LEBEDEV
Xcel, P.O.Box 73621, Lynnwood Ridge 0040, South Africa
swans@intekom.co.za
PHIL STAPLES
Conveyor Knowledge & Information Technology (PTY) Ltd. P. 0. Box 1677, Bedfordview 2008, South Africa
cdisa@icon.co.za
A case study is presented of a simulation model of an existing complex underground coal
mine and of a future coal supply chain to one of the operating power plants in South Africa whose
capacity is being extended. The purpose of the simulation study was to establish the sufficiency of the
mine capacity to meet the increased demand in future as well as the most feasible configuration of the
coal supply chain. The mine comprises 3 shafts, each consisting of a number of seams with a few
sections in every seam. Various mining methods are employed on the mine in different sections, and a
conveyor system with underground bunkers is used to deliver coal to the surface silos, from which coal
is transferred by overland conveyors to the main silos for further transportation to the power plant.
A number of alternative coal supply schemes were simulated for the comparative purpose to identify
the most technically and economically feasible option. Various scenarios were tested with conveying,
rail and combined schemes of transportation. The battery limits of the model were shuttle cars or
continuous miners in the mining sections, and the live stockpile of the power plant. The model
addresses the productivity of the mining sections, capacities of all conveyor belts, underground
bunkers, surface silos, stockyards, materials handling equipment, overland supply conveyors, coal
trains and transfer stockyards for the combined conveyor/rail transportation schemes. Effect of
breakdowns and other factors on the throughput of the whole system was investigated.
1. Introduction
Due to abundance of cheap mineable steam coal in South Africa virtually all the electric power is
generated in coal fired power plants. Concentration of the entire power generating industry in
Government hands has led to construction of very large efficient power plants, some of those being the
largest in the Southern hemisphere. Power cost in South Africa used to be the cheapest in the world
though recently it was taken over by Australia.
Growing electric power demand in South Africa and neighboring countries has resulted in higher
requirement for coal mining. This simulation study deals with the investigation of the ways to
increase production of coal in one of the mines potentially suitable to deliver extra tonnage to a
power plant whose capacity is being extended.
Simulation was chosen as one of the tools due to a complexity of the problem evolving from a number of
mining plan scenarios and options to deliver coal to the customer. Simulation has very well established
itself in the mining environment. The first models described in literature are dated 1961.
1,2 Various languages have been used to build models, including traditional 3rd level
algorithmic programming languages like Fortran and special simulation ones: GPSS, Slam, Siman/Cinema/
Arena, Witness, AutoMod to name just a few.3 Most of the simulation languages are based on events and
therefore models are discrete and event driven while traditional progamming languages normally use time
increments to update the values of variables and state of resources. Some of the simulation languages
like Arena and Witness for example, have both discrete and continuous modelling constructs sometimes
offering very good advantages as will be shown below. Update of the state and values of continuous
modelling elements is linked to time, and the shortest time increment is defined by the smallest
simulation clock tirne unit. Application of discrete and continuous modelling approaches to simulate
specifically bulk conveying systems widely used on the mines, is analysed in article.4
Some of the most typical applications of computer simulations to the mining industry are discussed in
Ref. 5. A generic shovel-truck-crusher-conveyor system, a commonplace in the open pit mines was
simulated and the influence of various factors on the production rate was analysed. Factors included
capacities of equipment, fleet size maintenance schedules and such like. Based on the simulation
results the bottlenecks of the mine were identified as well as the power of simulation modelling to
resolve most of the mine planning problems was once again proven.
Specific features of simulating mining equipment using AutoMod are discussed in article.6
Unfortunately no technical details were presented there, however 3-D animations illustrated in the
paper make the model very attractive to visualise motion of the machines in an underground mine.
Applications of computer simulation for the materials handling systems specifically are presented in
Refs. 7 and 8.
There are numerous other published papers dedicated to simulation modelling for the mines. A recent
MineSim'96 conference organised on the Internet containing most of the above references as well as
regular APCOM conferences (Application of Computers and Operations Research in Mining) supply a wealth
of information directly related to the topic. However it is important to note that the absolute
majority of the models described in literature are either discrete or (very seldom) continuous
systems. This paper will attempt to present a reasonably complex mining operation and coal
transportation system using a combined discrete and continuous simulation approach.
2. Problem Definition and Objectives of the Simulation Study
An existing coal-fired power plant in South Africa is in the process of increasing its generating
capacity by adding extra turbine units and boiler plant. The colliery currently feeding coal to the
power station cannot meet the increased demand and has limited reserves. Therefore, an alternative
supply source needs to be identified. One of the operating underground coal mines situated within a
130 km radius from the power plant is considered a potential supplier however with obligations to its
existing long-term customers, and in order to make-up a growing coal feed to the power plant a
possibility to increase its own production should be investigated. Various transportation routes can
be used to deliver additional volume of coal to the power station including rail or conveyor only and
combined, and an optimum scheme in terms of transportation cost per tonne of coal must be identified.
2.1. Coal mining
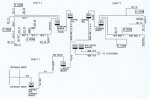
The colliery concerned consists of 3 shafts each comprising a few seams as schematically shown
in the simulation model layout in Fig. 1. In all numbered mining sections feed of coal into the system
is by shunting cars, and in other ones, continuous mining methods are employed (continuous mining,
shortwall, longwall).
Fig. 1. Schematic diagram of the mine.
There are two 5000 ton silos on the surface (main surface bunkers in Fig. 1), however their available
capacity is only 3750 tons. Discharge from each of the silos is by means of four vibrating feeders
each with a capacity of 450 t/h. Thus the output from each silo is a maximum of 1800 t/h. A control
philosophy was incorporated into the simulation model to regulate the feed from the shaft silos to the
main surface bunkers thus maintaining a consistent level in the silos, between full and empty limits.
Connecting shaft 2 and 3 silos with the main surface silos are each of three overland conveyors
connected in series.
All three shafts feed number one main surface bunker individually. Shafts 2 and 3 also have an
independent cross conveyor (not shown) between the silos to direct coal into silo 2. All silos and
surface bunkers are equipped with bin level indication to maintain a minimum residual filling of 15%.
A total of 51 conveyors including two units feeding coal to the current customer are employed on the
mine ranging from 1000 to 2000 t/h capacity and from 100 to 4000 m in length. Belt speeds vary from
2.58 to 3.79 m/s. Other equipment used on the mine is summarised in Table 1.
Table 1. Schedule of equipment other than conveyors employed on the mine.
Description |
Shaft 1 |
Shaft 2 |
Shaft 3 |
Surface |
Feeder breaker
Shuttle car
Continuous
miner |
4 units 600 to 1200 t/h
capacity each
9, 14 and 20 ton capacity
Instantaneous maximum capacity of
2500 t/h |
N/A
N/A
N/A |
Underground bunker
Surface silo |
1200 ton
N/A |
800 ton
5000 t |
1200 ton
5000 t |
N/A
2 x 5000t |
Vibrating feeder
Belt feeder |
N/A
N/A |
6 x 500 t/h units
2000 t/h |
4 x 450 t/h
N/A |
Fig. 2. Mining plan - all scenarios.
To meet an increased coal demand by the power plant and maintain existing customers, five alternative
coal mining scenarios were drawn by the mine engineers for analysis and simulation modelling (refer to
Fig. 2).
Total mined tonnage's indicated in Fig. 2 were broken down into shafts 1, 2 and 3 for every scenario,
and each of the shaft mining plans was further split into seams and mining sections.
The objective of the simulation exercise on the mining side was to verify sufficiency, and if
necessary recommend upgrading or replacement, of the following equipment:
- The existing overland conveyor system from shafts 2 and 3;
- All existing underground bunkers;
- New underground surge bunker proposed to shaft 1;
- All existing surface silos;
- All existing underground conveyors.
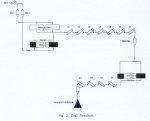
2.2. Coal supply chain
Three alternative options to deliver coal to the power plant were investigated:
- Conveyor only as shown in Fig. 3.
- Combined conveyor and rail. Compared to the previous option, instead of overland
conveyor system from stockyard 2 to the power plant live stockpile, a rail track was allowed for.
- Rail only, a direct transport link from stockyard 1 to the live stockpile of the power station.
Description of the above alternative coal transportation options is summarised in Table 2.
Table 2. Parameters of coal supply chains
| Option |
Distance |
Capacity |
Speed |
Conveyor
only |
First 7 flights
Next 4 flights |
±77 km
±63 km |
2500 t/h
2500 t/h |
6.5 m/s
6.5 m/s |
Combined
Scheme |
Conveyor 7 flights
rail track |
±77 km
±61 km |
2500 t/h
7700 t load per train |
6.5 m/s
11h23 min cycle time |
| Rail only |
±160 km |
19200 t load per train |
16h42 min cycle time |
Distances in Table 2 do not necessarily match each other due to different routing. Capacities of
conveyor belts were calculated based on the 97% availability of each individual unit, operating
schedule and required tonnage to deliver. Permissible loads on the rail track per axle determined the
train loads, and cycle times included shunting time, loading, brake test, travel time, shunting at the
destination station, unloading, brake test and travel back. All these calculations were required
upfront for incorporation into the model.
The objectives of the simulation study of the coal transportation alternatives were the following:
- Justify capacity of the new overland conveyor system;
- Size new surge bunkers;
- Size stockyards 1 and 2;
- Justify the required number of trains, calculated in advance and based on the train design load
and cycle time;
- Check train traffic schedules.
The principal indicator of meeting the above objectives was the annual delivered tonnage of coal to
the end user.
3. Simulation Approach and Assumptions
In general, simulation faced and integral task to quantify sizes of equipment and facilities in this
specific study. It was demonstrated that a continuous simulation modelling approach provides
significant advantages in terms of simulation execution time, ease of simulation of continuously
operating equipment (e.g. continuous miner) with sufficient accuracy of reproducing a real life in
terms of quantity of material and sizes of equipment and facilities.4 Therefore taking into
account the calibre of the system to simulate it was decided to use a continuous simulation modelling
approach. In these circumstances, coal was simulated as an item that can flow in streams like a fluid
flows through pipes. In mining sections where continuous mining methods were employed (continuous
miners, shortwall, longwall) directly feeding underground conveyors, coal was drawn from the virtual
source with the rate equivalent to an actual one measured on the mine. However in a number of mining
sections coal was delivered from the development face with shuttle cars of various size and injected
into the materials handling system via feeder-breakers. Shuttle cars cannot be simulated with
continuous modelling constructs, and the following approach was used:
- Shuttle cars were simulated as discrete entities with 2 attributes, one defining
that an entity contains an item, and the second one setting the content of the item equal to the
actual size of a shuttle car. A good mechanical analogy to illustrate this concept is a canister;
- The arrival of shuttle cars (entities) was approximated with a negative exponential distribution
sampling inter-arrival time. This distribution was obtained by fitting a standard formula to the
records of actual tips into feeder-breakers;
- On arrival to a feeder-breaker, a shuttle car goes through all the applicable steps with
associated time delays: manoeuvring and positioning, tipping (duration equivalent to discharging an
item with a finite rate), and leaving.
Trains featuring in transportation schemes were also discrete elements yet interfacing continuously
operating equipment. They were simulated as AGV's running in a loop on tracks and carrying an entity
containing some quantity of an item similar to the shuttle cars. The quantity was equivalent to the
actual train load. At loading and unloading stations trains exercise all the applicable time delays
adding up to cycle times as explained above. Loading and unloading duration's were determined by the
actual loading lunloading rates and the content of an item to fill and empty, respectively. Loading
starts as soon as an empty train becomes available but not more than the required number of trains was
loaded in a day. In this study train traffic congestion was not an issue as a brand new dedicated rail
link was under consideration.
The following shift pattern was assumed for the study (refer to Table 3):
Table 3. Operational shifts.
| Description |
Mine |
Conveyors |
Plant, trains |
| Weeks per annum |
52 |
50 |
52 |
| Days per week |
5 |
6 |
7 |
| Hours per day |
16 |
24 |
24 |
To size the required equipment (trunk belts, overland conveyors, storage buffers) an allowance was made
in the model for extra capacity to the design parameters, and regular readings of the current flows or
stock levels were recorded in histograms for further analysis based on the adopted confidence value.
In the event of very seldom occurrence of peak overloads the client had an opportunity to compromise
the size of a particular component of the system and save capital expenditure allowing for a
quantified risk of failure due to equipment overload.
The capacity of the existing stockyard had to be so planned as to maintain the maximum utilisation of
the reclaimer and the reclaim conveyor (that is, the reclaimer must always have some material in one
of the two stockpiles to reclaim). Therefore the definition of the required size of the stockyard was
based on the minimisation of the idling time of the reclaimer-conveyor combination.
Normally at least two beds were provided in each of the new stockyards. Stacking and reclaiming in a
stockyard was on the alternative basis: while one bed was stacked the other was reclaimed and vice
versa. It is important to note that the reclaimer never interrupted it's operation until a bed was
empty due to the higher priority to feed coal to the power station.
Once reclaiming was finished, stacking was interrupted irrespective of the degree of filling the other
stockpile, and stacker and reclaimer swapped around. If stacking was complete before reclaiming, the
stacker remained at that stockpile awaiting for the reclaimer to finish the job and only then the
machines would move. A 45 minutes time was allowed for the motion and set-up of stacker and reclaimer
from one stockpile to the other.
Reclaim rates from the stockpiles and discharge rates from the surge bunkers were sampled from a normal
distribution with mean values as per the relevant actual parameters for each simulated scenario.
To simulate availability of equipment, failures were assumed to occur a few times in a month depending
on specific equipment, and these were related to operating hours. Mean Time Between Failures (MTBF) was
simulated by negative exponential distribution, and Mean Time to Repair (MTTR) - by Gamma distribution
to obtain the design availability y parameters.
4. Discussion of Simulation Results
Due to a significant scope of simulation only fragments of most representable and typical results
obtained can be discussed here.
4.1. Mining operation
A typical histogram of coal level readings is presented in Fig. 4.
Similar histograms were obtained for all the underground bunkers, surface silos, stockpiles and were
found very useful by the mine engineers, as one of the conclusions, for example, was to eliminate a
1200 t underground bunker in shaft 1.
An example of the readings of the current flow rates of the trunk conveyors appears in Fig. 5. In all
simulated scenarios, conveyor flow rate histograms were used by the mine engineers for sizing. In some
cases a lower than 100% confidence level was used to rate conveyor capacities. However in some mining
sections, a safety factor was applied to the simulation results to cater for risk factors not
incorporated into the model.
Fig. 4. Coal level in shaft 2 surface silo.
Fig. 5. Flow rate of 2 seam trunk belt, shaft 2.
A summary of the required trunk conveyor belt capacities is presented in Table 4. Zero values in
Table 4 mean that coal mined in that specific mining area was not available to feed the power plant
and was destined to other customers.
Because of the uncertainty of the future mining plan and insignificant variation of required capacities
from one scenario to the other as can be seen from Table 4 for conveyors, a decision was taken to size
the main resources catering for all possible operating scenarios as summarised in Table 5.
One of the main results of this phase of the simulation study was a conclusion taken together with the
mine engineers to rather upgrade certain pieces of equipment than replace those, thus achieving
significant capital savings.
Table 4. hunk conveyor belt sizes in tonne per hour.
| Mining Area |
Opening Scenario |
1 |
2 |
3 |
4 |
5 |
| Shaft 1 |
900 |
1000 |
1100 |
900 |
1100 |
| Shaft 2, 5 seam |
500 |
500 |
500 |
500 |
0 |
| Shaft 2, 4 seam |
100 |
800 |
7000 |
800 |
1100 |
| Shaft 2, 2 seam |
700 |
1000 |
1000 |
1000 |
1100 |
| Shaft 3, 5 seam |
0 |
500 |
600 |
500 |
0 |
| Shaft 3, 4 seam |
800 |
600 |
800 |
600 |
700 |
| Shaft 3, 2 seam |
1000 |
800 |
1000 |
1000 |
1100 |
| Mine Total |
3200 |
3200 |
3800 |
3300 |
3200 |
Table 5. Recommended equipment capacities.
| Description |
Capacity |
| Main surface silo 1 |
3750 t |
| Main surface silo 2 |
3750 t |
| Shaft 1 underground bunker |
500 t |
| Shaft 1 trunk belt |
1200 t/h |
| Shaft 1 incline belt |
1200 t/h |
| shaft 2 surface silo |
5000 t |
| Shaft 2 incline belt |
2400 t/h |
| Shaft 2 underground bunker |
800 t |
| Shaft 2, 5 seam trunk belt |
1250 t/h |
| Shaft 2, 4 seam trunk belt |
1500 t/h |
| Shaft 2, 2 seam trunk belt |
1200 t/h |
| Shaft 3 surface silo |
3000 t |
| Shaft 3 incline belt |
2100 t/h |
| Shaft 3 underground bunker |
800 t |
| Shaft 3, 5 seam trunk belt |
2100 t |
| Shaft 3, 4 seam trunk belt |
1200 t/h |
| Shaft 3, 2 seam trunk belt |
1200 t/h |
An effect of the deviation in the mine's availability on its production performance appears in Fig. 6.
It is interesting to note that production falls with a faster rate then availability y. In other words,
each percent reduction in availability caused a 1.5 - 2.0% production loss.
This analysis made sense because of the natural wear of equipment that has been already in operation
for a number of years, and in the feasibility study it was necessary to determine the potential of the
operating mine to meet the future production target, with deteriorating availability.
Fig. 6. Loss of mine's production versus availability reduction.
4.2. Transportation schemes
4.2.1. Conveyor only transport option
One of the key issues in the process of capacity planning for any type of operation specifically of
capital-intensive nature is maximizing equipment utilisation. For supply chains it is normally a
function of two parameters: availability y of equipment and of the commodity to actually move.
Availability y of equipment is rarely under mine designer's control. However, availability y of the
material can be managed.
In this specific study, uninterrupted supply of coat to the power plant played an absolutely crucial
role, and utilisation of overland conveyors specifically was a very good indicator of how well that
role was performed. The specifics of conveyors comes from the use of multiple independently failing
units connected in series, when a broken-down unit caused blockage of all up-stream ones. Existing
stockyard No. 2 was found an extremely supportive resource to make up feed to the power plant when the
first chain of conveyors was down.
A substantial difference in utilisation of overland conveyors belonging to different chains (before
and after stockyard 2), can be seen from the chart in Fig. 7. Due to adopted availability value seven
units could reach utilisation less than 80% only though coal was always available in stockyard 1,
while the second chain of 4 units was utilised at about 85% level.
The same observation was made on the utilisation of stackers and reclaimers. Reclaimer and stacker in
the first conveyor chain were utilised at approximately the same level of ±78% as the overland
conveyors, and these in the 2nd chain - at ±85%.
Fig. 7. Utilisation of overland conveyors.
4.2.2. Combined conveyor and rail coal supply scheme
This scheme differs from the previous one by replacement of the second conveyor chain with a rail
track. Because of the buffer in between (stockyard 2) overland conveyors were performing very
closely to the first scenario. Fig. 8 shows an example of the rolling stock utilisation.
Fig. 8. Typical rolling stock utilisation chart.
Interestingly to note that despite the absence of traffic congestion (a sufficient number of bypass
sidings was allowed for), the sum of idling and shunting time (here the term shunting time includes
actual manoeuvring, brake test and queuing duration's or in other words any time delays other than
traveling, loading/unloading and breakdown) was nearly 50%. However, the visual observation of
animation and experimentation with the model showed that the number of trains initially allowed was
minimum and could not be reduced.
4.2.3. Rail only transport link
This was the easiest alternative to simulate. The task was limited to checking the delivery
performance by rail scheduled in advance in terms of size and number of trains to be loaded in a day
as well as stockpile capacities. Two trainloads of 19200 ton a day were sufficient to maintain the
required feed into the powerplant, and the stockpile capacities are summarised in Table 6.
Table 6. Parameters of coat handling, transportation by rail only.
| Capacity of stockpiles in stockyard |
t |
2 x 100000 |
| Average reclaim rate from stockyard |
t/h |
3500 |
| Capacity of the loadout (dispatch) bunker |
t |
8000 |
| Capacity of powerplant live stockpile |
t |
250000 |
5. Recommendations Evolved from the Study
Simulation study proved that the mine concerned had a spare capacity to increase production and
provide extra coal feed to the power station. A set of detailed recommendations was worked out to
upgrade equipment conforming to the new production target. It was also suggested to avoid installation
of a new underground bunker proposed by the mine. All these measures allowed to significantly reduce
capital expenditure.
Various new coal supply chains were analysed with the simulation model, and all of
them were quantified and optimised in terms of equipment utilisation. Technical feasibility of coal
transportation alternatives was proven, and equipment design criteria deducted from the simulation
study were used to price the alternatives for selection of the most economically and technically
feasible solution.
References
- R. Sturgul, History of discrete mine system simulation, Mine Simulation, Proc. First Int. Symp
on Mine Simulation via the Internet. 2-13 December 1996. G. N. Panagiotou, J. R. Sturgul, eds., A. A.
Balkema Publishers, Rotterdam, 1997.
- J. R. Sturgul, Annotated bibliography of mine system simulation (1961-1995), Ibid.
- J. R. Sturgul, Simulation languages for mining engineers, Ibid.
- A. A. Lebedev, Simulation modelling of bulk conveying systems, Simulation, February 1998.
- D. W. H. Ellis, Mine design using simulations, Mine Simulation, Pmt. First Int. Symp. on Mine
Simulation via the Internet, 2-13 December 1996, G. N. Panagictou, J. R. Sturgul, eds., A. A. Balkema
Publishers, Rotterdam, 1997.
- N. Vagenas, D. Monette, T. Corkal and M. Scoble, Simulation of underground hard rock mining using
automod, Ibid.
- J. C. Yingling, The use of sirnulation,in design of mine conveyor and bulk materials handling
systems, Ibid.
- A. Lebedev and P. Staples, Simulation of materials handling systems in the mines: Two case
studies, Simulation, March 1998.